Maximum Mathematics
A comprehensive Asymptote library for creating professional mathematical diagrams and visualizations.
Design principles
This is a highly opinionated design and visualization library. Using the basic methods will cause every visualization to share a consistent theme throughout the library. Deviating from the theme it provides — especially in how individual visualizations are rendered — may require heavy modification.
The library is designed so users only have to focus on providing the data needed to create a visualization. It eliminates most of the styling and rendering-algorithm decisions, offering a simple interface for producing a wide variety of visualizations.
Design philosophy
Every figure follows the same path:
- Create a visualization and configure its data (constructor + fluent methods).
- Create an
Imageand configure it with setter methods (size, padding, caption, background). - Add the visualization to the image with
image.add(visualization).
That last step renders automatically — you never call a render, draw, or output function yourself. The only exception is the escape hatch: if you want the bare visualization without an enclosing image, you call the visualization’s own render(width, height) directly (see Standalone rendering).
basic_usage.asy
// 1.) Import the MaximumMathematics library
import MaximumMathematics;

// 2.) Create the visualization
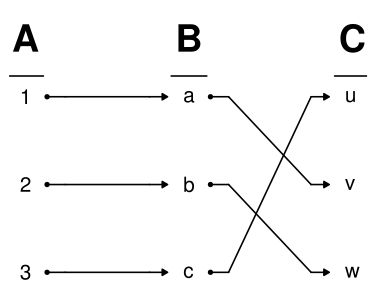
RelationDiagram diagram = RelationDiagram();
diagram.add_set(new string[] {"1", "2", "3"}, "A");
diagram.add_set(new string[] {"a", "b", "c"}, "B");
diagram.add_set(new string[] {"u", "v", "w"}, "C");
diagram.add_relation(0, 1, new pair[] {(0,0), (1,1), (2,2)});
diagram.add_relation(1, 2, new pair[] {(0,1), (1,2), (2,0)});

// 3.) Create and configure an Image to hold the visualization
Image img = Image();
img.padding(0.2);

// 4.) Add the visualization to the Image
img.add(diagram);
This snippet is a complete, standalone .asy file — there’s nothing else to add. Running Asymptote directly on it produces the image below.
There are no configuration structs and no wrapper types: you configure everything through setter methods on the object itself.
What’s in the library
| Page | What it covers |
|---|---|
| Installation | Cloning the repo and pointing Asymptote at it |
| Image | The canvas every visualization is drawn into |
| Gallery | Arranging several visualizations in a grid |
| Visualizations | RelationDiagram, TruthTable, AccumulationTable, Plot, DiscretePlot, SwitchingNetwork, GraphDiagram |
| Standalone rendering | Rendering a visualization without an enclosing Image |
| Output and viewing | Choosing an output format and viewing rendered SVGs |
| Styling and typography | The shared theme file, and how to restyle the library |
Credits
Maximum Mathematics — created by Jacob Hiance.