The Image
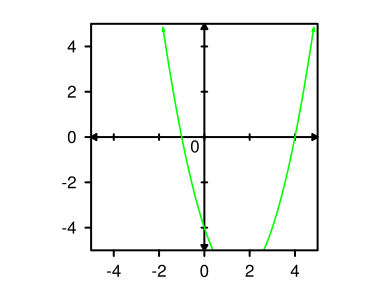
Image is the container most commonly used to display a visualization. Once you’ve created one, it can be configured in a variety of ways to help your visualization look its best.
no_caption_with_visual.asy
// 1.) Import the MaximumMathematics library
import MaximumMathematics;

// 2.) Create a visualization (documentation for supplying any desired data is available for all visualization types)
real_function_1 f = new real(real x) {return x^2 - 3*x - 4;};
Plot plot = Plot();
plot.set_window(-5, 5, -5, 5);
plot.add(f);

// 3.) Create the Image that will hold the visualization, and configure it
Image image = Image();
image.padding_horizontal(1);

// 4.) Add the visualization to the Image and render it
image.add(plot);
Captions
A caption has two optional parts, laid out as one line: a left-aligned title, and left-aligned, word-wrapped text immediately following it. When both are given, a colon and a space are inserted between them automatically — caption_title("Figure 1") + caption_text("A basic sine curve.") renders as “Figure 1: A basic sine curve.”, so leave the colon out of the title yourself. A lone title or lone text (only one of the two given) is rendered as-is, flush with the caption zone’s left edge.
caption_with_visual.asy
// 1.) Import the MaximumMathematics library
import MaximumMathematics;

// 2.) Create a visualization (documentation for supplying any desired data is available for all visualization types)
real_function_1 f = new real(real x) {return sin(x);};
Plot plot = Plot();
plot.set_window(-5, 5, -2, 2);
plot.add(f);

// 3.) Create the Image that will hold the visualization, and configure it
Image image = Image();
image.width(12);
image.height(12);
image.caption_title("Figure 1");
image.caption_text("A basic sine curve.");

// 4.) Add the visualization to the Image and render it
image.add(plot);
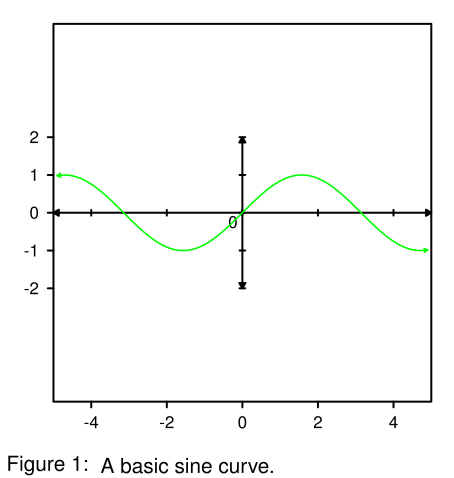
Provide only caption_title, only caption_text, or both. Provide neither and no caption zone is created. Both parts support LaTeX math. Wrapped continuation lines (once the text runs past the first line) stay indented under where the text started, rather than restarting at the caption zone’s left edge underneath the title.
Automatic sizing
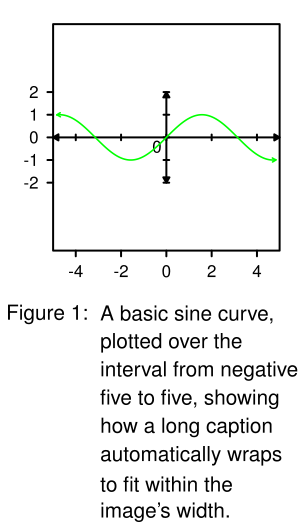
The caption zone’s height is never set directly — there’s no caption_height method. Instead it’s measured from the actual caption content and sized to fit exactly: caption_text is word-wrapped to the image’s own width, and the zone’s height grows to fit however many lines that wrapping produces. A short caption gets a short zone; a long one wraps across as many lines as it needs and the zone — and so the whole rendered picture, since the caption zone stacks beneath the visualization area — grows to match. There’s nothing to configure to make this happen: change the caption text or the image width, and the zone resizes itself accordingly.
long_caption_with_visual.asy
// 1.) Import the MaximumMathematics library
import MaximumMathematics;

// 2.) Create a visualization (documentation for supplying any desired data is available for all visualization types)
real_function_1 f = new real(real x) {return sin(x);};
Plot plot = Plot();
plot.set_window(-5, 5, -2, 2);
plot.add(f);

// 3.) Create the Image that will hold the visualization, and configure it
Image image = Image();
image.width(8);
image.height(8);
image.caption_title("Figure 1");
image.caption_text("A basic sine curve, plotted over the interval from negative five to five, showing how a long caption automatically wraps to fit within the image's width.");

// 4.) Add the visualization to the Image and render it
image.add(plot);
Images without captions
With no caption, the whole rendered picture is just the visualization area plus its padding. debug() draws that area’s border so you can see exactly what padding leaves for a visualization to fill — call it after add()/add_visual(), since there’s nothing to outline until the image has actually been rendered.

debug()
debug()Images with captions
Once a caption is added, debug() also draws the separator between the visualization area and the caption zone, and — when both a title and text are given — the boundary between them.
debug()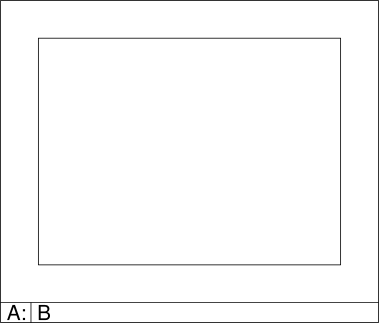
debug()Configuration methods
| Concern | Methods |
|---|---|
| Dimensions — the visualization area only | width(real width)height(real height) |
| Padding (around the visualization, inside its area) | padding(real padding)padding(real horizontal, real vertical)padding(real left, real top, real right, real bottom)padding_horizontal(real padding)padding_vertical(real padding)padding_left(real padding)padding_top(real padding)padding_right(real padding)padding_bottom(real padding) |
| Caption | caption_title(string title)caption_text(string text) |
| Background | background_color(pen color) |
| Debug | debug() |
| Add + render | add(visualization) |
Defaults
| Parameter | Default |
|---|---|
width | 10 |
height | 8 |
| Padding (all sides) | 0 |
| Caption title | none ("") |
| Caption text | none ("") |
| Background color | white |