DiscretePlot
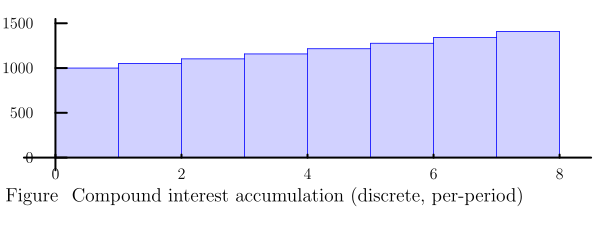
A discrete step/bar plot sampling a function at the left, middle, or right of each interval — useful for Riemann-sum and accumulation illustrations.
real value(real x) { return 1000 * exp(log(1.05) * x); }

DiscretePlot g = DiscretePlot(1, 0, "left", 8, value);
g.set_window(-0.5, 8.5, 0, 0);   // ymin == ymax => auto-compute the y-window

Image img = Image();

img.width(12);

img.height(6);
img.padding(0.5);
img.caption_title("Figure 3");
img.caption_text("Discrete accumulation, sampled per period.");
img.add(g);
Methods
| Method | Purpose |
|---|---|
DiscretePlot(dx=1, first_x=0, anchor="left", steps=10, func=identity, xmin=0, xmax=0, ymin=0, ymax=0) | Build and sample |
set_dx / set_first_x / set_steps(...) | Change sampling geometry |
set_anchor("left"\|"mid"\|"right") | Where each interval is sampled |
set_function(func) | Replace the function and re-sample |
set_window(xmin, xmax, ymin, ymax) | Set the view (equal min==max leaves that axis auto) |
set_debug_mode(bool) | Draw bounds |